Customize | Visualize | Process | Retain
For best results, view on computer (not mobile devices)
follow us
@SharpFootball
Ultimate Collection of 2017 NFL Strength of Schedule Research Tools
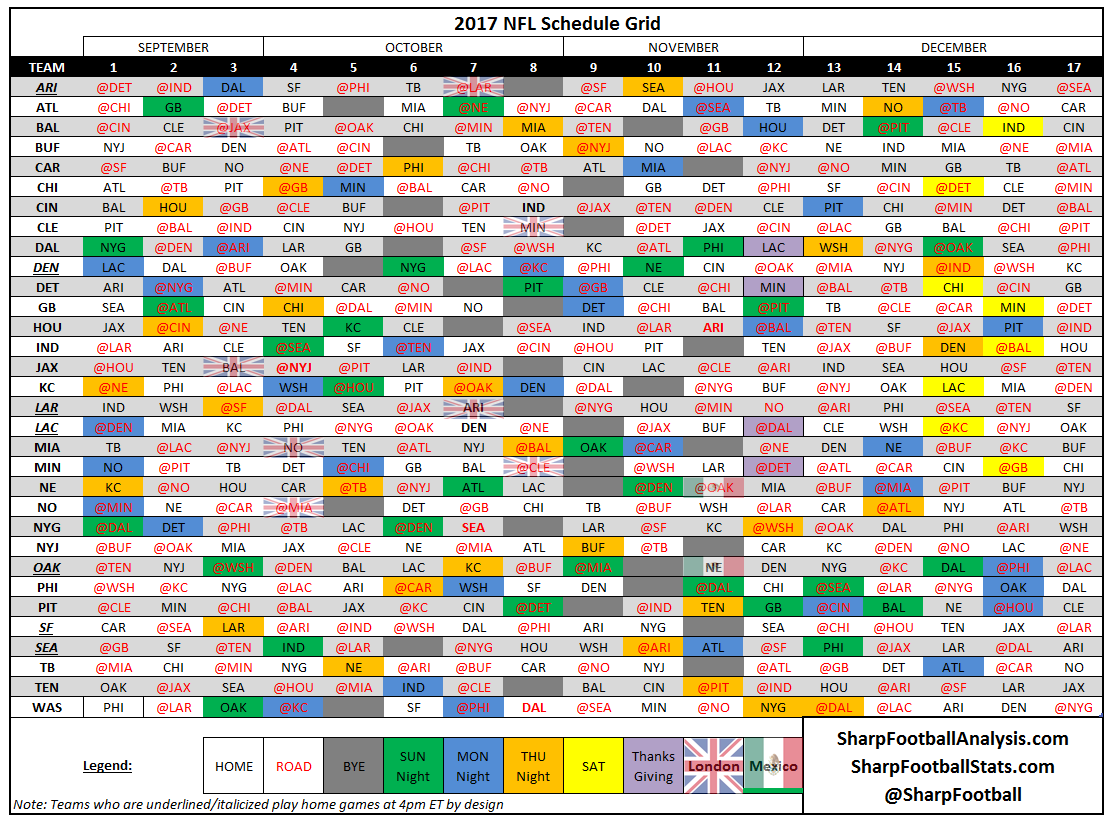
The NFL released the 2017 regular-season schedule, but unfortunately it was a continuation of confusion and misinformation regarding which teams are going to face the most difficult schedule this year. But first, let's take a quick snapshot of the 2017 schedule looking at all 16 games for all of the 32 teams in one handy picture (that you can save to your phone):
Most people probably realize the NFL has an innovation problem. There is a hesitation to do things different, even when it's more intelligent to do so. There are many examples including roster construction, utilization, playcalling etc. unfortunately, it is likewise ramp it among the NFL analyst community from mainstream media.
I cannot tell you how many times I have seen teams' 2017 schedule ranked according to opponents prior year (2016) win-loss record. It's a terribly inaccurate way to look at the season, but because the analysis is extremely simplistic and easy to execute (read: lazy), NFL fans get spoon fed the least accurate information possible with regard to forecasting 2017 strength of schedule.
The method that I first introduced to the community and began using several years ago was to measure future season strength of schedule with future season predicted win totals from the betting market. It was a far more accurate (read: stronger correlation) means to forecast strength of schedule (though admittedly every single pre-season method has its drawbacks). For a variety of reasons, unlike years past, the Vegas sports books have been reluctant to post win totals and at this time there are currently no lined forecasted win totals. This is a huge shift from prior seasons, when books used them as a marketing tool to be the first to the market and gain the free press and notoriety which followed. When they are released I will share that analysis but for now, and even more accurate way to take a snapshot of a particular unit is by measuring the strength of schedule based upon specific team analytics.
At my stats website, Sharp Football Stats.com, I developed 3 key pages for you to visually see and compare 2017 NFL Schedules and Strength of Schedule for all 32 teams. I'll quickly describe what these pages are and how to take advantage of the unique information they display. But early next week, I'll write an article for Rotoworld where I will tell you specific takeaways for every single of the 32 NFL teams. Click the header for each section below to jump to that page over at Sharp Football Stats.com.
1) Offensive Strength of Schedule
On this page, you can examine how a particular team's schedule looks over the course of the season based on over 30 different metrics, such as opponent:
- Defensive efficiency
- Pass defense
- 3rd down defense
- Explosive passing defense and many more
This is a key page for fantasy football fans who are drafting offensive players this spring and summer. For instance, you can see the brutal start to the season for the Los Angeles Chargers passing offense by way of measuring the opposing pass defense efficiency they will face on a weekly basis:

On this same page, you can see league-wide metrics which indicate strength of schedule compared to the rest of the NFL. It breaks it down not only in total defensive efficiency, but you can see ranked two pass defense metrics and two rush defense metrics. The beauty of this page is you can sort by week (by using the top left). So you can look at which teams face the most difficult start or finish to the season.

So when we were looking at the brutal start to the season for the Los Angeles Chargers passing offense above, we can now see exactly how difficult that start to the season is as compared to other teams:

Here is a snapshot of some of the 30+ metrics you can visualize for every single team on a weekly basis:

2) Defensive Strength of Schedule
This page is quite similar to the page above, except obviously it visualizes strength of schedule for defenses as compared to the rest of the NFL. Once again, you are able to select certain weeks to determine which defenses have the hardest or easiest start or finish to the season, or look at the season as a whole. So it breaks down the caliber of opposing offenses faced, and ranks the teams from 1 to 32 in terms of 2017 NFL Strength of Schedule for defenses:

3) 2017 vs 2016 NFL Strength of Schedule
This page is one of the most fascinating. It displays over 24 metrics for strength of schedule on offense and defense to show what that team is compared to the rest of the NFL. But it also shows how that rank in 2017 compares to what that team was in 2016. It is a fascinating look.
For example, as the below shows, the Oakland Raiders offense (left side of the visualization) will face significantly more difficult run defenses in 2017 than they faced in 2016. The defensive run efficiency of their 2017 opponents is the 8th most difficult schedule, whereas in 2016, they faced the 28th rated schedule (or 5th easiest). That is the largest increase in difficulty from 2016 to 2017 that any team in the NFL will face.

I created a video which describes the utility of this page:
As you can see, visualizing strength of schedule metrics is extremely useful and resonates quickly. Browse and research these pages in preparation for the 2017 NFL season. Of course, I'll be sharing a ton of similar graphics and in-depth analysis related to strength of schedule and much more in my 2017 Football Preview which will be distributed in a magazine format at Amazon.com in late June.
Tutorial Video
Join the Sharp Football
Mailing List: